

Environmental impact
- data has been verified
{GRI Podejście do zarządzania, 4.11.}
When considering our environmental impacts, at the LOTOS Group we are especially concerned with gas emissions, which are the most critical source of environmental nuisance, both for the immediate environment of our plants and other areas located further away. The approach to emissions of greenhouse gases, including carbon dioxide (CO2), methane (CH4), nitrous oxide (N2O), fluorinated hydrocarbons (HFCs), perfluorinated hydrocarbons (PFCs) and sulphur hexafluoride (SF6), is becoming an increasingly more important element of the assessment whether a company operates in accordance with the principles of sustainable development and corporate social responsibility. Recently, we have also seen a wave of increased stakeholder interest in these issues, especially after the 19th edition of the Conference of Parties (COP19) organized by Poland, during which representatives of many countries from around the world were discussing the risks entailed by climate change, as well as ways of preparing for and possibly counteracting such change.
At Grupa LOTOS, given that we participate in the EU Emissions Trading Scheme and have a sense of our material contribution to the country’s climate policy, we attach great importance to all issues related to the emissions of greenhouse gases as a result of the processes taking place in our installations. In all our projects we consistently stick to the policy of taking into consideration and implementing the Best Available Technologies for our processes.
{GRI EN16, EN17}
CO2 is the only greenhouse gas discharged from Grupa LOTOS’ installations . As in the previous year, we did not take continuous measurements of carbon dioxide emission volumes, but instead used a methodology based on calculating those volumes.
2013 was the first year when the manner of monitoring emission volumes of carbon dioxide and other greenhouse gases was centrally regulated – by the EU. This centrally imposed methodology compelled us to introduce some modifications in our approach to the assessment of measurement uncertainty and risk involved in the monitoring process. The consumption of input fuels and materials classified as main streams, namely fuel gas, natural gas and fuel oils, is measured using the most advanced and accurate Coriolis mass flowmeters, which guarantee that the highest accuracy standards are met. In turn, analyses of the parameters (calculation coefficients) of those fuels and materials are performed by an accredited LOTOS Lab laboratory. There was a slight change in the reference calculation coefficients we use for certain smaller streams of fuels and materials. We consult these, as well as any other, changes in the method of monitoring carbon dioxide emissions with a reputable, accredited EU ETS verifier.
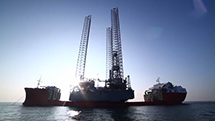
The Diesel-powered internal combustion engines of the energy generation system, the steam boilers and crane engines are all sources of greenhouse gas emissions. On the Baltic Beta platform, gases are emitted by the turbines running on gas separated from crude oil. An additional source of greenhouse gas emissions comes from the gas flared on the platform. On the Baltic Beta platform, most excess gas is compressed and returned to shore where it is used for powering other turbines, hence flaring is reduced to a minimum. All the gas produced on the ‘Petrobaltic’ platform is burned in flare stacks, which are designed to minimise the emission of harmful substances. All of its CO2 emissions come from the combustion of natural gas and fuel oil in the generation of electricity and heat.
Natural gas extracted from under the Baltic Sea bed does not contain any chemical compounds or substances which could produce emissions of any greenhouse gases other than CO2 during combustion. The methane which is a component of fuel gas is burnt up and is not emitted into the atmosphere. Other products of gas separation (liquefied petroleum gas (LPG) and natural gas condensate (NGC)) do not contain greenhouse gases and do not produce emissions of any gases other than CO2 when used by end users.
LOTOS Geonafta’s hydrocarbon production operations in Lithuania generate relatively low emissions of harmful substances, which is why no emissions monitoring is undertaken there. As for LOTOS Norge, in 2013 it did not conduct any operations which could be a source of greenhouse gas emissions.
| CO2 emissions in 2013 | Unit. | Volume |
|---|---|---|
| LOTOS Petrobaltic* | tonne | 17,599 |
| Energobaltic | tonne | 11,784 |
Emission volumes including offshore activities.
{GRI EN18}
During the overhaul shutdown performed at the refinery in 2013, we introduced a number of low-emission improvements, which have contributed positively to our performance.
Type of CO2 emissions in Grupa LOTOS [thousands of tonnes per year]
| Type of emission | 2011 | 2012 | 2013 |
|---|---|---|---|
| Direct | 2,045 | 1,979 | 1,689 |
| Indirect | 365 | 400 | 373 |
| Total | 2,410 | 2,379 | 2,062 |
A reduction in emissions of carbon dioxide and other pollutants into the atmosphere was achieved also thanks to the completion in 2013 of the following projects:
- Replacement of process furnaces at the gasoline hydrorefining and oils refining units – the new furnaces are much more energy efficient compared with the old units;
- Upgrade of the third boiler at our CHP plant and its adaptation to the burning of natural gas;
- Construction of a flare gas recovery unit, which redirected 45% of the total volume of flare gases to the fuel gas network between the beginning of September and the end of the year.
The only significant source of indirect emissions in Grupa LOTOS is in the purchase and use of electricity. It should be noted that in 2013 we significantly reduced the use of heavy fuel oil as a fuel for heat generation, replacing it with more environmentally friendly fuel gas, the main ingredient of which is natural gas.
These projects allowed Grupa LOTOS to reduce its carbon dioxide emissions by approximately 185 thousand tonnes in 2013.
{GRI EN20}
Apart from carbon dioxide, Grupa LOTOS is also required to monitor emissions of such substances as sulphur dioxide (SO2), nitrogen oxides (NOx), and particulate matter (PM). The method of monitoring these pollutant emissions remained unchanged from the previous year. Measurements are performed separately for two installations: the CHP plant and the refinery. An online measurement system has been fitted inside the flue gas stack of the CHP plant, which continuously indicates the average concentrations of emitted oxides and particulate matter. Emissions from the refinery are calculated based on periodic measurements.
Pollutant emissions in Grupa LOTOS [tonnes per year]:
| Substance | 2011 Es | 2011 Ed | 2012 Es | 2012 Ed | 2013 Es | 2013 Ed | ||
|---|---|---|---|---|---|---|---|---|
| SO2 | 5,708 | 7,137 | 3,370 | 6,342 | 548 |
5,169 | ||
| NO2 | 1,620 | 2,650 | 1,308 | 2,501 | 843 |
2,264 | ||
| PM | 344 | 556 | 264 | 461 | 91 |
366 | ||
Es - actual level of emissions from Grupa LOTOS installations
Ed - permissible level of emissions
In LOTOS Petrobaltic, fuel combustion emissions of such substances as nitrogen and sulphur oxides are due mainly to the combustion of fuel oils. It needs to be emphasised that none of the emissions from the LOTOS Petrobaltic Group’s production operations contain any ozone-depleting substances.
Pollutant emissions in the LOTOS Petrobaltic Group in 2013 [tonnes]
| Substance | Unit | Volume |
|---|---|---|
| LOTOS Petrobaltic | ||
| SOx | tonne | 4.53 |
| NOx | tonne | 26.88 |
| Dust | tonne | 2.88 |
| LOTOS Geonafta | ||
| SOx | tonne | 0.46 |
| NOx | tonne | 2.95 |
| VOC (volatile organic compounds) | tonne | 69.54 |
| Dus | tonne | 0.29 |
| Energobaltic | ||
| SOx | tonne | 0.004 |
| NOx | tonne | 11.23 |
| Dust | tonne | 0.005 |
{GRI OG6}
In 2013, a flare gas recovery unit was put in service at the Grupa LOTOS refinery in Gdańsk. The unit was fitted on one of the two discharge ducts leading to flare 3500. To achieve the greatest possible mitigation of environmental nuisance while ensuring that the project remains economically viable, the unit’s connection point was located on the duct which carries the vast majority of all flare gases produced in Grupa LOTOS.
Amount of discharge – amount of flare gas in Grupa LOTOS [thousand cubic metres per year]
| Source | Unit | 2011 | 2012 | 2013 |
|---|---|---|---|---|
| Flare 3500 | thousand cubic metres | 21,036 | 19,388 | 16,363 |
| Flare 3550 | thousand cubic metres | 10,819 | 3,603 | 5,499 |
| Total | thousand cubic metres | 31,855 | 22,991 | 21,862 |
Significant volumes of flare gases are produced at shutdowns and startups of installations. Given that an overhaul shutdown was performed in our refinery in 2013, the aggregate volumes of gas being burned in flares should have been significantly higher than in previous years. However, the construction of a flare gas recovery unit, in addition to many other minor improvements, reduced the aggregate annual volumes of flared gases.
The extent to which Grupa LOTOS managed to reduce its environmental impact is also reflected by the figures showing a reduction in our air emissions.
| Action | Emission reduction in 2013 [tonne]* | |||
|---|---|---|---|---|
| CO2 | SO2 | Pył | NOx | |
| Replacement of fuel oil with natural gas in the fuel gas network | 35,000 | 1,960 | 150 | 190 |
| Replacement of fuel oil with natural gas at the CHP plant | 68,000 | 1,420 | 60 | 220 |
| Replacement of light petrol/LPG with natural gas in the Hydrogen Generation Unit (HGU) | 82,000 | 0 | 0 | 0 |
| Total | 185,000 | 3,380 | 210 | 410 |
* compared with production conditions of 2011.
{GRI EN19}
In 2013, as in previous years, we did not use any ozone-depleting substances, neither did we introduce any products the use of which would cause atmospheric emissions of such compounds.
In the years to come, we want to continue our efforts to gradually reduce emissions of carbon dioxide and other pollutants into the atmosphere, through further:
- increasing the share of natural gas in our fuel gas network;
- reducing the consumption of heavy fuel oil by replacing it with fuel gas.
Energy efficiency
{GRI EN5, EN6}
The energy efficiency of all production units used by Grupa LOTOS is one of our top priorities. Our steady progress in this area is reflected in the comparative performance analyses of the refining industry published by Solomon Associates.
In the latest Solomon report for 2012, Grupa LOTOS was named the most energy efficient fuels refinery in Central Europe and Southern Europe, and secured one of the top positions in Europe.
We constantly undertake new initiatives to improve the refinery’s energy efficiency. In 2013, the key project consisted in replacing process furnaces at two refining units, i.e. the gasoline hydrodesulphurisation unit and the oils refining unit.
The new furnaces are highly efficient, with an energy efficiency ratio of over 90%. By using advanced, highly efficient technological solutions, we also reduced the consumption of primary energy, which relative to 2012 was down 28% and 30% in the fuel and lube complexes, respectively.
As a result of the work performed during the overhaul shutdown and rational management of process media, we managed to permanently reduce the refinery’s consumption of compressed (control) air by 20%.
In 2013, we also took steps to lower the indirect use of energy by the refinery. To this end, low voltage switchgears were modernised and inverters were installed on the supplies of the motors of all cooling fans in one of the cooling water units. This solution enhances the cooling efficiency and saves electricity through flexible control of the rotational speed of the fan motors in individual cooling units. The system was put in service in late 2013. We also continued to use LED lights on a test basis.
Given the requirements of the Act on Liquid Biocomponents and Biofuels, the Grupa LOTOS refinery’s fuel products contain biocomponents (renewable energy carriers): ethanol and ethyl tert-butyl ether are used in gasoline production, whereas fatty acid methyl esters are added to diesel oils. According to the current quality requirements for liquid fuels, the permitted ethanol and ethyl tert-butyl ether content in gasoline is 5% and 15%, respectively. Similarly, the volume of fatty acid methyl esters in diesel oils must not exceed 7%. The total required content of biocomponents in motor fuels is set by the state. In 2013, the Council of Ministers issued a Regulation on National Indicative Targets for 2013-2018, whereby the NIT was set at 7.10%, which means that biocomponents must account for 7.10% of the energy content of fuels marketed in Poland. Grupa LOTOS has met this requirement.
{GRI EN3}
Direct energy consumption of Grupa LOTOS in 2013, by primary energy source [GJ]
| Item | Unit | Direct − purchased energy | Direct − produced energy | Direct − sold energy | Direct − total energy consumption |
|---|---|---|---|---|---|
| Natural gas | GJ | 7,943,250 |
0 |
0 |
7,943,250 |
| Fuel gas | GJ | 0 |
9,542,926 |
140,807 |
9,402,119 |
| HSFO+Bleed fuel oil | GJ | 0 |
0 |
0 |
0 |
| LSFO | GJ | 0 |
1,952,920 |
0 |
1,952,920 |
| Light fuel oil (HON) | GJ | 0 |
25,043 |
0 |
25,043 |
| Electricity | GJ | 0 |
0 |
0 |
0 |
| Heat | GJ | 0 |
0 |
118,054 |
-118,054 |
| Residual gas | GJ | 0 |
3,258,653 |
0 |
3,258,653 |
| Total | 7,943,250 |
14,779,542 |
258,861 |
22,463,931 |
{GRI EN4}
Indirect energy consumption of Grupa LOTOS, by primary energy source
| Year | Unit | Amount of electricity purchased from the National Power Grid |
|---|---|---|
| 2011 | GJ | 4,163,239 |
| 2012 | GJ | 4,407,590 |
| 2013 | GJ | 4,036,944 |
The main source of energy used on the drilling platforms is diesel oil, supplied by ships, as well as natural gas extracted together with oil.
On the ‘Petrobaltic’ platform, energy is generated by a system of power engines and generators running on diesel oil, which meets the requirement to keep sulphur content below 1%. Energy generated in this way is then distributed throughout the platform. On the ‘Baltic Beta’ platform, energy is additionally generated by gas turbines powered by gas separated from the formation fluid, composed chiefly of crude oil. In LOTOS Geonafta, energy on the rigs is produced by a diesel generator.
Direct energy consumption of LOTOS Petrobaltic in 2013, by primary energy source
| Item | Unit | Direct − purchased energy | Direct − produced energy | Direct − sold energy | Direct − total energy consumption |
|---|---|---|---|---|---|
| Natural gas | GJ | 0 |
53,048 |
25,139 |
27,910 |
| Diesel oil | GJ | 106,733 |
0 |
0 |
106,733 |
| Total | GJ | 106,733 |
53,048 |
25,139 |
134,643 |
Direct energy consumption of LOTOS Geonafta in 2013, by primary energy source
| Item | Unit | Direct − purchased energy | Direct − produced energy | Direct − sold energy | Direct − total energy consumption |
|---|---|---|---|---|---|
| Natural gas | GJ | 2,521 |
0 |
0 |
2,521 |
| Fuel gas | GJ | 0 |
17,056 |
0 |
17,056 |
| Diesel oil | GJ | 24,874 |
0 |
0 |
24,874 |
| Total | GJ | 27,395 |
17,056 |
0 |
44,451 |
Direct energy consumption of Energobaltic in 2013, by primary energy source
| Item | Unit | Direct − purchased energy | Direct − produced energy | Direct − sold energy | Direct − total energy consumption |
|---|---|---|---|---|---|
| Natural gas type E (GZ 50) | GJ | 17,679 |
0 |
0 |
17,679 |
| Natural fuel gas (dry) | GJ | 262,519 |
0 |
0 |
262,519 |
| Light fuel oil | GJ | 116 |
0 |
0 |
116 |
| Electricity | GJ | 0 |
50,033 |
47,968 |
2,065 |
| Heat | GJ | 0 |
134,163 |
102,275 |
31,887 |
| Total | GJ | 280,314 |
184,196 |
150,243 |
314,266 |
Indirect energy consumption of LOTOS Petrobaltic in 2013, by primary energy source
| Unit. | Quantity | |
|---|---|---|
| Energy purchased for the land base’s operations | GJ | 5,948 |
Indirect energy consumption of LOTOS Geonafta in 2013, by primary energy source
| Item | Unit | Quantity |
|---|---|---|
| Energy purchased for administrative purposes | GJ | 1,256 |
| Energy for production purposes | GJ | 11,826 |
| Total | GJ | 13,082 |
Indirect energy consumption of Energobaltic in 2013, by primary energy source
| Unit | Quantity | |
|---|---|---|
|
Energy purchased |
GJ | 26,539 |
Raw materials and consumables used
{GRI EN1}
Raw materials used in exploration and production are substances used in the drilling and production processes. In the case of drilling, these include:
- Drilling mud components (materials),
- Cement used to bond well casing to the drilled rock.
LOTOS Petrobaltic does not use oil-based muds for drilling. All muds used on the drilling rig are water-based. Drilling mud components are brought to the platform, where they are added to water to obtain drilling mud of the required physical and chemical properties. The main ingredients of drilling mud are bentonite or metal salts (KCl, NaCl), with baryte or galena as weighting agents. Various other chemical substances are added to achieve the required properties.
The main raw materials used in the production process include also:
- Chemical substances (materials) added to the formation and produced water injection system,
- Materials used as filter inserts (anthracite, ground nut shells, gravel of different grain size, metal and fibrous filter inserts).
Formation water is saturated brine, mostly chlorine, sodium and calcium brine.
From the point of view of environmental protection, injection of water into a deposit does not pose any environmental threat because the applied pressure does not exceed the fracture pressure of the rock layer, and so does not affect its structure. However, the presence of water in extracted crude oil poses the problem of its disposal or recycling by further technological process. So far, the main method of managing this highly mineralised formation water, extracted together with oil, consists in separating it from the oil in separators, and discharging it into the sea after cleaning it to a level below 15 ppm of oil components (in accordance with the requirements of MARPOL 73/78 and HELCOM).
In order to protect the Baltic Sea and meet the environmental requirements set forth in the Baltic Sea Action Plan, such as those imposing a total ban on discharge of waters, including treated formation water, directly into the sea, LOTOS Petrobaltic has built an installation which pumps produced waters back into the deposit. Consequently, all formation water is pumped back to the deposit it came from, together with the sea water. This solution does not interfere with the marine environment or with the formation of oil-bearing strata, but merely returns the extracted substance.
Water parameters around the platforms are continually monitored in order to ensure that they meet the relevant environmental requirements. We carry out regular monitoring of multiple parameters, including hydrocarbon content in the water, chemical and biological oxygen demand, chlorides, sulphides, bacteria, surfactants and others.
The cementing process uses water-based slurry with chemical additives which delay the setting time. The purpose here is to bond the casing pipes to the drilled levels, prevent contact between drilled rock layers of different pressure gradients, and ensure tightness of the uncased section to prevent the overflow of drilling mud or substances extracted during operations. The parameters are monitored before, during and after drilling, in accordance with the relevant environmental decisions and approvals. Any variations that may occur are due to country-specific regulations. The Baltic Sea is particularly sensitive, which is why operations on the Baltic Sea are governed by more rigorous regulations than those applicable in other areas.
Raw materials and consumables used in 2013 by the LOTOS Petrobaltic Group, by weight and volume (tonnes)
| LOTOS Petrobaltic | |
|---|---|
| Injected and formation water | Volume |
| Biocides | 10.17 [t] |
| Coagulants | 1.69 [t] |
| De-emulsifiers | 8.84 [t] |
| Other | 15.16 [t] |
| Total | 35.9 [t] |
| Drilling mud | Volume |
| Bentonite | 19.3 [t] |
| Salts (drilling mud and packer fluid) | 78.8 [t] |
| Hydroxides | 2.9 [t] |
| Other (for maintaining appropriate properties - viscosity, filtration, etc) | 22.8 [t] |
| Total | 123.8 [t] |
| Cement slurry | Volume |
| Cement | 430.6 [t] |
| Processing agents | 14.4 [t] |
| Total | 445.0 [t] |
| Total | 604.7 [t] |
| Transport of gas from the platform via pipeline to Władysławowo | Volume |
| Methanol | 8.08 [t] |
| LOTOS Geonafta | |
| Substances used in the drilling process | Volume |
| Acid inhibitors | 6.95 [t] |
| Drilling mud additives | 111.40 [t] |
| Polymers | 48.31 [t] |
| Blokers | 29.25 [t] |
| Lubricants | 1.40 [t] |
| Cement | 162.42 [t] |
| Extraction additives | 111.40 [t] |
| Total | 471.13 [t] |
| Substances used in the production process | Volume |
| Corrosion inhibitors | 2.16 [t] |
| De-emulsifiers | 29.28 [t] |
| Oxidants | 0.20 [t] |
| Total | 31.65 [t] |
| Total | 502.78 [t] |
| Energobaltic | |
| Stage I - Gas Compressor Station | Volume |
| Input material: waste gas | 9,790,352 [Nm3] |
| Indirect production material: methanol | 10,200 [l] |
| Stage II - Gas/Input Material Separator Station | Volume |
| Input material: waste gas (wet) for LPG production | 4,966.58 [t] |
| Input material: natural gas condensate | 1,613.51 [t] |
| Obtained natural fuel gas (dry) as a fuel for heat and electricity generation | 5,250,374 [Nm3] |
Raw materials and consumables used by Grupa LOTOS, by weight and volume (tonnes)
| Raw materials | Unit | 2011 | 2012 | 2013 |
|---|---|---|---|---|
| Crude oil | tonne | 9,163,836 | 9,673,647 | 8,702,622 |
| Raw materials and components | tonne | 1,062,156 | 833,610 | 834,114 |
| Enhancing additives | tonne | 2,254 | 2,091 | 1,994 |
Water consumption
{GRI EN8, GRI EN9}
The refinery draws water from the nearby Motława river, which is its only source of surface water. Given the risk of seawater influx into the river near our intake, to ensure an adequate supply of freshwater the refinery draws water into a retention tank with a capacity of 350,000 m3, constructed in the Motława oxbow lake. Underground water is sourced from Cretaceous and Quaternary formations. Cretaceous water drawn by means of two wells is an important source of water for human use. Because of its quality, Quaternary water is used solely for industrial purposes, and given that our intake from these formations is relatively small, the source is classified as immaterial.
Economic use of the natural environment, including water resources, is based on relevant water-law permits and an integrated permit for drawing water from Cretaceous wells. The environmental impact of water intake is assessed during each permit application procedure. Inspections carried out near the refinery's underground and surface water intakes confirm that our water intake does not affect any protected sites or areas of great environmental value.
We consistently maintain water consumption substantially below the prescribed volumes. In 2013, the volume of surface water drawn by the refinery represented 28.9% of the permitted volume, with Quaternary and Cretaceous waters at 0.4% and 59.2% of the respective limits.
Total freshwater drawn by Grupa LOTOS, by source (m3/year)
| Source | Unit | 2011 | 2012 | 2013 |
|---|---|---|---|---|
| Underground water | m3 | 202,429 | 189,217 | 162,511 |
| Surface water | m3 | 3,607,427 | 3,532,113 | 3,574,791 |
| Total | m3 | 3,809,856 | 3,721,330 | 3,737,302 |
Grupa LOTOS processes consuming large quantities of water
| Source | Unit | 2011 | 2012 | 2013 |
|---|---|---|---|---|
| CHP plant – production of utilities | m3/year | 2,929,811 | 2,936,080 | 2,778,592 |
| Refinery – circulatory cooling water | m3/year | 1,386,304 | 1,503,995 | 1,418,925 |
Freshwater for the needs of the LOTOS Petrobaltic platforms is extracted from a deep well, for which the company holds the required permit. The amount of water drawn is closely monitored and remains below permitted levels. The amount of water drawn from the Baltic Sea for the needs of the rigs is negligible in relation to its total water resources – 303,121 m3 out of 21,727 m3. It should also be noted that none of the other companies of the LOTOS Petrobaltic Group are depleting water resources through excessive withdrawal.
Water is used on the platforms for human use and for technological purposes. In addition to freshwater, seawater is also used for production purposes, for example in the water injection system. This water is drawn directly from the sea by means of deep-well pumps.
Total freshwater drawn by LOTOS Petrobaltic in 2013, by source (m3)
| Source | Unit | Amount of water drawn |
|---|---|---|
| Freshwater – own intake | m3 | 27,645 |
| Freshwater – municipal water supply | m3 | 2,467 |
| Seawater | m3 | 303,121 |
| Formation water | m3 | 94,366 |
| Total | m3 | 427,599 |
Total freshwater drawn by LOTOS Geonafta in 2013, by source (m3)
| Source | Unit | Amount of water drawn |
|---|---|---|
| Freshwater | m3 | 3,012 |
| Water for technological purposes | m3 | 1,855 |
| Total | m3 | 4,867 |
Total freshwater drawn by Energobaltic in 2013, by source (m3)
| Source | Unit | Amount of water drawn |
|---|---|---|
| Water drawn from municipal network | m3 |
4,853
|
{GRI EN10}
Grupa LOTOS seeks to increase the volume of reused water and wastewater. Our goal is to increase the share of recycled water in our overall process water consumption. In this way, we keep the use of natural resources to a necessary minimum. For a number of years now, we have been witnessing measurable effects of our efforts, as the percentage of reused water in our overall water consumption continues to rise. Recycled water includes industrial water produced from treated wastewater as well as condensate returned to the boiler feedwater.
Volume of water recycled in Grupa LOTOS (m3)
| Unit | 2011 | 2012 | 2013 | |
|---|---|---|---|---|
| Industrial water produced from treated wastewater | m3 | 1,179,317 | 1,254,556 | 1,368,844 |
| Pure condensate volume | m3 | 2,030,131 | 2,207,217 | 2,237,300 |
Total volume of water recycled in Grupa LOTOS
| Unit | 2011 | 2012 | 2013 | |
|---|---|---|---|---|
| Total volume of recycled water | m3 | 3,209,448 | 3,461,773 | 3,606,144 |
| Percentage of recycled water | % | 45.7 | 48.2 | 49.1 |
{GRI EN21, EN25}
Treated wastewater from the Grupa LOTOS treatment plant is discharged to the Martwa Wisła river. The receiving body was historically a part of the Wisła Leniwka river. The reservoir was cut off from the main course of the Wisła in the 19th century, following construction of the Wisła cutting and the Przegalina sluice. The Martwa Wisła waters in the refinery area are classified as internal seawaters.
The second stream of water discharged from the plant consists of treated drainage water and clean rainwater, which are directed to the Rozwójka river, an element of the Żuławy Gdańskie hydrological improvement system and a tributary of the Martwa Wisła.
Neither of these receiving waters are protected or have high biodiversity value in the discharge area. Furthermore, long-term monitoring has confirmed that wastewater discharged by Grupa LOTOS has no material impact on them. Additionally, despite many years of operation, the refinery does not seem to materially affect any of the habitats located in the vicinity of its discharge areas.
The separate treatment lines allow us to redirect almost all oily rainwater after treatment, to produce industrial water which is fed back to the plant and reused. Only excess volumes of treated oily rainwater are discharged, together with technical wastewater and greywater/blackwater, to the receiving body.
Total volume of wastewater from Grupa LOTOS, by quality and destination (m3)
| Unit | 2011 | 2012 | 2013 | |
|---|---|---|---|---|
| Rozwójka | m3 | 3,874,089 | 4,305,910 | 4,220,723 |
| Martwa Wisła | m3 | 1,354,015 | 1,293,596 | 1,273,851 |
| Total | m3 | 5,228,104 | 5,599,506 | 5,494,574 |
Treated wastewater discharged by Grupa LOTOS into the Martwa Wisła river
| Measure | Unit | 2011 Wr | 2011 Wd | 2012 Wr | 2012 Wd | 2013 Wr | 2013 Wd |
|---|---|---|---|---|---|---|---|
| pH | - | 7.81 | 6.50-9.00 | 7.79 | 6.50-9.00 | 7.56 | 6.50-9.00 |
| Biological Oxygen Demand | mg O2/dm3 | 2.68 | 25.00 | 2.56 | 25.00 | 2.99 | 25.00 |
| Chemical Oxygen Demand | mg O2/dm3 | 34.00 | 125.00 | 30.20 | 125.00 | 44.10 | 125.00 |
| Suspended solids | mg/dm3 | 7.89 | 35.00 | 6.38 | 35.00 | 7.89 | 35.00 |
| Volatile phenols | µg/dm3 | 1.00 | 100.00 | <5.00* | 100.00 | <0.005* | 100.00 |
| Substances extractable with petroleum ether | mg/dm3 | 0.58 | 50.00 | 0.74 | 50.00 | 0.73 | 50.00 |
| Petroleum hydrocarbons | mg/dm3 | 0.83 | 5.00 | 1.93 | 5.00 | 0.23 | 5.00 |
| Total Nitrogen | mg/dm3 | 2.90 | 30.00 | 2.40 | 30.00 | 4.30 | 30.00 |
| Total Phosphorus | mg/dm3 | 1.07 | 3.00 | 1.03 | 3.00 | 0.57 | 3.00 |
| Sulphides | µg/dm3 | 2.00 | 200.00 | 6.00 | 200.00 | 9.00 | 200.00 |
| Nickel | µg/dm3 | 10.10 | 500.00 | 10.20 | 500.00 | 17.05 | 500.00 |
| Vanadium | µg/dm3 | 36.30 | 2,000.00 | 28.90 | 2,000.00 | 19.10 | 2,000.00 |
| Aluminium | µg/dm3 | 92.20 | 3,000.00 | 62.40 | 3,000.00 | 69.00 | 3,000.00 |
Wr - actual average annual level
Wd - permissible average annual level
* result below the quantification limit for the analytical method used in a given year
Treated wastewater discharged by Grupa LOTOS into the Rozwójka river
| Measure | Unit | 2011 Wr | 2011 Wd | 2012 Wr | 2012 Wd | 2013 Wr | 2013 Wd |
|---|---|---|---|---|---|---|---|
| Suspended solids | mg/dm3 | 11.92 | 35.00 | 10.71 | 35.00 | 9.50 | 35.00 |
| Petroleum hydrocarbons | mg/dm3 | 1.64 | 5.00 | 2.15 | 5.00 | 0.74 | 5.00 |
Wr - real average annual value
Wd - permissible average annual value
All oily wastewater is stored on the LOTOS Petrobaltic platforms in special containers, and later taken ashore for disposal. Greywater/blackwater is processed in a biological treatment station and then released to the sea. The condition of seawater around the platform is monitored on a daily basis. Similarly, no wastewater produced by LOTOS Geonafta in its drilling operations is discharged directly into natural bodies of water (lakes and rivers). All technological wastewater and greywater/blackwater is stored and subsequently transported to a wastewater treatment plant.
Volume of wastewater produced in 2013, by destination (m3)
| LOTOS Petrobaltic | Unit | Volume |
|---|---|---|
| Greywater/blackwater | m3 | 7,546 |
| LOTOS Geonafta | Unit | Volume |
| Greywater/blackwater | m3 | 3,012 |
| Energobaltic | Unit | Volume |
| Greywater/blackwater | m3 | 617 |
{GRI OG5}
All formation water produced by LOTOS Petrobaltic in the oil extraction process is pumped back to the reservoir it came from.
Volume and disposal method of formation water and water produced by LOTOS Petrobaltic in 2013
| Item | Unit | Volume |
|---|---|---|
| Degree of oil contamination of formation water | ppm | 7.64 |
| Water injected back to the reservoir | m3 | 94,366 |
Volume and disposal method of formation water and water produced by LOTOS Geonafta in 2013
| Unit | Volume | |
|---|---|---|
| Formation water | m3 | 246,333 |
In LOTOS Geonafta, all formation water produced in the oil extraction process is stored on the rig and then transferred for disposal.
Waste management
{GRI EN22}
Management of waste generated by Grupa LOTOS is carried out in compliance with EU and national regulations, ensuring maximum safety for the environment. As a result of the work performed during the overhaul shutdown in 2013, noticeably more waste was produced, which, however, comprised mostly non-hazardous waste.
Waste generated by Grupa LOTOS − quantity [tonnes/year]
| Waste generated by Grupa LOTOS | 2011 | 2012 | 2013 |
|---|---|---|---|
| Waste stored at the end of the previous year | 2,244 | 2,195 | 1,777 |
| Generated hazardous waste | 7,338 | 6,784 | 6,478 |
| Generated non-hazardous waste | 5,046 | 5,574 | 6,659 |
| Total generated waste | 12,384 | 12,358 | 13,137 |
| Volumes permitted by the integrated permit | 89,627 | 89,627 | 89,627 |
| Waste generated by service providers | N/A | 4,154 | 3,170 |
Our endeavours towards environmentally friendly waste management is evidenced by the fact that in 2013 we managed to recycle all waste produced by the Grupa LOTOS refinery.
Waste management methods applied by Grupa LOTOS − quantity [tonnes/year]
| Waste management method | 2011. | 2012 | 2013 |
|---|---|---|---|
| Waste recycled | 12,428 | 12,749 | 13,504 |
| Waste treated or disposed of | 4 | 28 | 0 |
| Incineration | 4 | 27 | 0 |
| Landfilling | 0 | 1 | 0 |
| Waste stored on site at the end of the year | 2,196 | 1, 777 | 1,410 |
| Hazardous | 1,977 | 1,503 | 1,376 |
| Non-hazardous | 219 | 274 | 34 |
{GRI EN24}
The only hazardous waste sent abroad by Grupa LOTOS are used catalytic converters. Foreign companies have the appropriate technologies to manage such waste in an environmentally friendly way.
Type of hazardous waste generated by Grupa LOTOS
| Type of waste | Unit. | 2011 | 2012 | 2013 |
|---|---|---|---|---|
| Hazardous waste transported from external sources (from outside the LOTOS Group) to the refinery | tonne | 21 | 0 | 0 |
| Hazardous waste transported from the refinery to external sites in Poland | tonne | 6,286 | 7,258 | 6,352 |
| Hazardous waste transported from the refinery to external sites outside of Poland | tonne | 119 | 0 | 253 |
| Total hazardous waste transported | tonne | 6,426 | 7,258 | 6,605 |
| Percentage of waste transported across international borders | % | 2 | 0 | 3.8 |
{GRI EN23}
In 2013, there were two incidents involving hazardous substances at the Grupa LOTOS refinery, but their potential impact was limited to the immediate area and neither of them resulted in environmental pollution, as confirmed by appropriate tests carried out under the inspection of the Pomeranian District Inspector for Environmental Protection.
In 2013, the LOTOS Petrobaltic Group did not report any significant spills into the environment.
{GRI EN22, GRI OG7}
Drill cuttings (small pieces of rock fragmented by the advancing drill bit) are the main waste product of the drilling process. Once carried to the surface, they are directed to the drilling mud treatment system. Drill cuttings do not contain any of the substances listed in Annex 1 to the Helsinki Convention. Drill cuttings with drilling mud from primary and secondary treatment are discharged to the seabed after being separated and washed, whereas drill cuttings from tertiary treatment are carried ashore and transferred to a waste management company. Every batch of disposed drill cuttings is tested for toxic content. Drilling mud, on the other hand, is recycled so it can be reused in the drilling process. When drilling mud is not suitable for recycling, it is also taken ashore and transferred to a waste management company.
Waste generated by LOTOS Petrobaltic − quantity [tonnes/year]
| Generated waste | 2013 |
|---|---|
| Generated hazardous waste | 38 |
| Generated non-hazardous waste | 644 |
| Total generated waste | 682 |
Waste generated by LOTOS Geonafta − quantity [tonnes/year]
| Generated waste | 2013 |
|---|---|
| Generated hazardous waste | 22 |
| Generated non-hazardous waste | 3,966 |
| Total generated waste | 3,988 |
Waste generated by Energobaltic − quantity [tonnes/year]
| Generated waste | 2013 |
|---|---|
| Waste stored at the end of the previous year | 0.07 |
| Generated hazardous waste | 0.42 |
| Generated non-hazardous waste | 0.808 |
| Total generated waste | 1.30 |
Waste management methods applied by LOTOS Petrobaltic − quantity [tonnes/year]
| Waste management method | 2013 |
|---|---|
| Waste recycled | 141 |
| Landfilling | 541 |
| Waste stored on site at the end of the year: | 0 |
| hazardous | 0 |
| non-hazardous | 0 |
Waste management methods applied by LOTOS Geonafta − quantity [tonnes/year]
| Waste management method | 2013 |
|---|---|
| Waste treated or disposed of | 3,988 |
| Landfilling | 0 |
| Waste stored on site at the end of the year: | 0 |
| hazardous | 0 |
| non-hazardous | 0 |
Waste management methods applied by Energobaltic - quantity [tonnes/year]
| Waste management method | 2013 |
|---|---|
| Waste treated or disposed of | 0.65 |
| Waste recycled | 0.40 |
| Landfilling | 0.25 |
| Waste stored on site at the end of the year: | 0.146 |
| hazardous | 0.101 |
| non-hazardous | 0.045 |
All drilling mud and drill cuttings generated by LOTOS Petrobaltic are produced using water-based drilling fluid. In the process of drilling, drill cuttings (small pieces of drilled rock, containing 5%-10% of drilling mud) are separated from drilling mud. The quantity of drill cuttings differs depending on the drilling interval and its diameter.
The chemical composition and environmental impact of drill cuttings depend on the type of drilling mud being used. In order to completely eliminate the chemical activity of produced waste, the use of the simplest type of drilling muds was designed for the process. The drilling muds were tested for their impact on the marine environment (a study entitled ‘Determination of the potential impact of drilling mud on the marine environment of the Baltic Sea’ prepared at the Gdańsk University of Technology) and considered environmentally non-toxic.
LOTOS Geonafta used only water-based drilling mud in its production operations. Most of its ingredients are biodegradable. All technological water, drilling mud and drill cuttings are carried away for disposal.
Waste generated in 2013 - Drill cuttings [tonne] (LOTOS Petrobaltic)
| Drill cuttings | Unit | Total weight |
|---|---|---|
| transferred as waste | tonne | 94 |
| discharged to the sea | tonne | 1,054 |
| Total | tonne | 1,148 |
Waste generated in 2013 [tonne] (LOTOS Petrobaltic)
| Drilling mud | Unit | Total weight |
|---|---|---|
| in circulation | tonne | 1,141 |
| transferred as waste | tonne | 340 |
| discharged to the sea | tonne | 144 |
| Total | tonne | 1,625 |
Waste generated in 2013 [tonne] (LOTOS Geonafta)
| Unit | Total weight | |
|---|---|---|
| Drill cuttings | tonne | 1,601 |
| Drilling mud and technological water | tonne | 2,322 |
| Total | tonne | 3,924 |
{GRI EN27}
In accordance with applicable regulations, the LOTOS Group companies have engaged recycling contractors for recovery and recycling of packaging introduced to the domestic market.
At Grupa LOTOS, LOTOS Oil and LOTOS Paliwa, the aggregate recovery rates for packaging waste were in line with the statutory requirements and in 2013 stood at 58.5% for recovery and 50% for recycling. Tar papers were a product sold by LOTOS Asfalt in packaging until mid-2013 Altogether, the recovery rate for used packaging waste for this company was 58.5%, with the recycling rate at 15.8%.
Transport
{GRI EN29}
Transport is another key area in which we seek to mitigate our environmental impact.
All bitumen and heavy fuel oil transport for the Polish market is coordinated by LOTOS Asfalt. In 2013, road tankers carried nearly 510 thousand tonnes of products, covering more than 11.5 million kilometres and consuming more than 3.5 million litres of fuel. To limit exhaust gas emissions, the company’s products are first transported to distribution centres by rail, and only then dispatched to customers in road tankers. The products are reloaded in modern handling terminals, where harmful vapour emissions are minimised.
Seeking to protect the environment, LOTOS Kolej, the company providing transport services i. a. to the LOTOS Group’s companies, keeps increasing the share of electric traction transport, gradually replacing diesel locomotives. As at the end of 2013, the company used 91 locomotives, including 54 electric vehicles.
Due to traction issues, a portion of transport and shunting work is still carried out using diesel locomotives.
Share of electric and diesel traction in overall transport (%)
Diesel oil consumption by LOTOS Kolej diesel locomotives in 2011-2013 (thousand litres)
Traction electricity consumption by LOTOS Kolej electric locomotives in 2011-2013 (MWh)
Out of the total volume of fuels sold by LOTOS Paliwa in 2013, 7% was transported by rail and 26% by road tankers, with the balance represented by fuels collected from storage depots by customers using their own means of transport. In 2013, no fuel spills were reported in road or rail transport.
Mitigation of environmental impact
{GRI EN26}
Refinery
The environmental impact of Grupa LOTOS products is unavoidable. Fuels provide energy which is released through combustion, emitting exhaust gas. The efficiency of chemical energy conversion into usable forms of energy (mechanical or thermal) depends on the design of the engine, rather than the fuel itself. Even so, we take steps to make sure that our fuels do not have a significant environmental impact.
All Grupa LOTOS products meet the quality requirements prescribed by law, and in some environmentally relevant respects they even exceed the legally required standards.
- The sulphur content in Grupa LOTOS gasolines and diesel oils is substantially below the legal threshold. In 2013, the average annual sulphur content in motor gasolines and diesel oils was 3.3 ppm and 5.5 ppm, respectively, considerably beneath the required maximum of 10 ppm. This results in substantially lower sulphur dioxide emissions.
- The aromatics content in Grupa LOTOS fuels is also considerably lower than that prescribed by applicable laws. In the case of unleaded gasoline type 95, the average aromatics content in 2013 was 29.7%, less than the legal threshold of 35%. For diesel oils, the content of polycyclic aromatic hydrocarbons is limited to 8% of the fuel’s weight. However, in 2013 the average PAH content in our B7 diesel oil was only 0.8% in weight terms. Consequently, this oil produces less soot during combustion, which translates into lower particulate emissions in exhaust fumes.
{GRI OG8}
Benzene, sulphur and lead content in Grupa LOTOS fuels
| Substance | j.m. | 2012 - volume | 2012 - volume (average) | 2013 - volume | 2013 - volume (average) |
|---|---|---|---|---|---|
| Benzene (in gasolines) | % V/V | 0.5 - 1.0 | 0.8 | 0.4 - 1.0 |
0.9 |
| Sulphur (in gasolines) | mg/kg | 1.0 - 9.9 | 3.9 | 0.1 - 7.9 |
3.3 |
| Sulphur (in diesel oil) | mg/kg | 1.4 - 9.5 | 5.5 | 2.0 - 10.0 |
5.5 |
| Lead (in gasolines) | mg/kg | 0 | 0 | 0 |
0 |
Detailed information regarding the properties and composition of fuel products are available for our customers at www.lotos.pl/en, where descriptions of all our products along with their Safety Data Sheets are published. On request, the Sheets are also available at LOTOS service stations.
Another long-used method of mitigating the environmental impact of fuels is the use of biocomponents, which can be considered renewable energy sources, and therefore limit the impact of fuel combustion on the environment.
Logistics is another area where the environmental impact of fuel products may be mitigated, by preventing product losses into the environment. In 2013, we launched a new Vapour Recovery Unit (VRU) at the refinery in Gdańsk, to recover the vapours of gasoline. The new unit enables more efficient removal of gasoline vapours from the air pushed out of rail tankers during loading, with three times the capacity of the old one (3,000 m3/h). Thanks to the investment, the volume of hydrocarbons released into the atmosphere is minimised, which reduces the environmental impact of logistics operations related to gasoline handling.
Bitumens
We take steps to eliminate hydrocarbon release related to the production, storage and transport of bitumens, which produce olfactory nuisance, especially within the production plants. Completed projects which are part of this strategy include in particular:
- Jasło: construction of a thermal afterburner, air-tightening of tanks and connecting the air-tight tanks and bitumen nozzles to the thermal afterburner;
- Gdańsk: connection of all road and rail tank nozzles to a vapour extraction system, air-tightening of tanks, connection enabling treatment of extracted vapours in thermal afterburners, construction of an auxiliary unit for treatment of vapours collected from the nozzles with activated charcoal.
Following completion of the project in 2013, the aerosanitary conditions in the area improved substantially.
Rail operations
In 2013, we completed an overhaul and modernisation of the advanced rail tanker cleaning facility, operated by LOTOS Kolej in Gdańsk. Apart from the main facility, the project involved the construction of a specially designed track fitted with an additional station for removing LPG residues from tankers and feeding them to flare stacks. The range of services was also extended to include shot blasting of internal tanker surfaces.
Oils
In 2013, the LOTOS Oil production branch in Czechowice-Dziedzice was working on solutions designed to limit soil, surface water and groundwater contamination. As a result of this work, double bottoms were installed in selected tanks.
Fuels
In 2013, we continued to invest in mitigating the environmental impact of existing LOTOS service stations. These activities included modernising the fuel facilities by installing gasoline vapour recovery units, adding new equipment for measuring and monitoring petroleum product stocks, as well as detecting and signalling any petroleum product leaks to surface water and groundwater, and replacing single-shell tanks with double-shell units.
Production
One of the most important elements in mitigating the impact of production operations on the natural environment consists in protecting the sea from possible pollution by extracted oil and accompanying substances, and minimising the environmental damage should such an emergency occur. To remain prepared for response to potential emergencies, every year we run obligatory drill exercises on tackling oil spills. In 2013, such training was carried out in the Gdańsk Bay, with the participation of Maritime Search and Rescue services and the Maritime Office in Gdynia. At the same time, LOTOS Petrobaltic updated its Oil Spill Response Plan for spills resulting from exploration and production work conducted within its licence areas, which is part of the National Plan to Combat Pollution of the Marine Environment.
One of the most important activities to ensure a clean environment and mitigate adverse impacts is environmental monitoring, which is the study of the environment before, during and after operations. This relates chiefly to seawater and bottom sediment testing. Another important aspect of the process is the management of waste generated on the rigs, based on the ‘zero discharge’ policy, covering both post-consumer and production waste.
Chemicals used in the drilling process circulate within a closed system, not entering in any contact with the environment. In order to ensure that the arrangements set out in the Baltic Sea Action Plan are followed, in 2013 LOTOS Petrobaltic equipped the production rig with an installation for pumping oily formation waters.
Biodiversity
{GRI EN11, EN12, EN13, EN14, EN15, OG4}
Marine environment
As at the end of 2013, LOTOS Petrobaltic held eight crude oil and natural gas exploration and production licences in Polish marine areas. Previously, only one of them, SAMBIA W, bordered on conservation areas of the Baltic Sea coast, protected under the EU Birds Directive. Currently, the newly acquired licences Słupsk W and Słupsk E border on the Słupsk Shoal (Ławica Słupska), which is a marine site of the NATURA 2000 network as defined by the Birds and Habitats Directives.
One of the most important elements in mitigating the impact of production operations on the natural environment consists in protecting the sea from possible pollution by extracted oil and substances accompanying the drilling process, and minimising the environmental damage should such an emergency occur.
Surveys have shown seabed degradation over vast stretches of the central Baltic Sea, caused primarily by accumulations of undegradable organic matter, as well as reduced oxygen content at depths of more than 60 metres. An animal that can be found in this area, although irregularly and very rarely, is the harbour porpoise. In 2013, we took samples for the purpose of biodiversity testing together with bottom sediment samples. The samples, however, contained too little fauna and flora material to perform biodiversity tests.
Our activities in the Baltic Sea consist in exploration for and production of crude oil from the seabed. Exploration work can be divided into two stages:
- Seismic surveys, which show where hydrocarbons can be found;
- Test drilling to make a preliminary estimate of the size of a reservoir and its resources, which helps evaluate the economic viability of future production.
Seismic surveys involve generating acoustic waves, which affect the sea fauna. An environmental decision issued by the Regional Directorate for Environmental Protection is required to commence such work. An opinion from the Director of the relevant Maritime Office is also needed. The environmental decision specifies the requirements which must be met in conducting the planned work. In this respect, LOTOS Petrobaltic strictly complies with all the procedures and requirements laid down in the applicable laws and regulations. The Soft Entrance procedures are applied in seismic work, under which the intensity of a seismic source is gradually ramped up so as to allow the fish and porpoises inhabiting the area to leave the affected region.
Although the oil deposits beneath the Baltic Sea floor are low-pressure reservoirs, the risk of an eruption during appraisal work and test drilling must be taken into account. Therefore, the procedures to be followed during such operations are very detailed, and provide for all safety measures following from best practice and best technology solutions to reduce, insofar as practically possible, the risk of an eruption. An oil spill would have negative consequences, especially for the bird populations. However, considering that crude oil produced from the Baltic Sea is light oil and 30% of its volatile fractions would evaporate within the first few hours of a spill, and that HELCOM recommends mechanical collection of oil contamination from the sea surface while restricting the use of dispersants causing the clumping and sinking of oil particulates, the impact of a spill on the environment would be minimised.
The main output of the production process is formation fluid, which is separated on the drilling rig into crude oil, natural gas and formation water, the latter being injected back into the reservoir to an appropriate depth in order to maintain the reservoir pressure. Natural gas is transported to LOTOS Energobaltic, where it is used to generate electricity. Such measures also help protect the air, in line with the requirements of Annex VI to MARPOL Convention 73/78 and the Baltic Sea Action Plan.
The licence areas where LOTOS Petrobaltic may explore for and produce crude oil and natural gas are located outside the so-called Baltic Sea Protected Areas. As a result, the exploration and production operations conducted within the licence areas pose a negligible threat to protected areas and the maritime environment. The Baltic Sea Protected Areas are given priority when it comes to tackling oil spills in sea waters, with the key objective to prevent any contamination from entering those areas.
Onshore areas controlled by LOTOS Geonafta are located approximately 700 metres from NATURA 2000 sites. The company manages surface water runoff in a comprehensive way, by using, among other measures, an appropriate system of drainage canals. The level of air and groundwater pollution is also monitored. All projects are preceded by environmental impact reports, with data for the purpose of environmental impact assessment provided by continuous monitoring. Periodic analyses have not shown any impact of the exploration and production operations on the biodiversity of the neighbouring conservation areas.
Refinery’s surroundings
We are consistent in making biodiversity protection a priority for our planned and ongoing investment projects. In order to obtain an environmental decision, an environmental impact assessment must be performed for every major project which may have a significant effect on the environment. As part of this process, a comprehensive environmental impact assessment report is prepared, containing an obligatory description of the project’s effect on biodiversity. In our effort to uphold the principles of corporate social responsibility, Grupa LOTOS goes above and beyond the statutory requirements, thoroughly covering biodiversity issues in such reports.
Our commitment to mitigating the adverse impact of our operations on the local fauna and flora is also evidenced by the fact that one of our key environmental objectives for 2014 is to perform a large-area inventory of elements comprising the environment within and surrounding our refinery in Gdańsk. We intend to use the inventory data as a basis for future initiatives to help us manage the biodiversity risks in the refinery’s vicinity.
In 2013, our standing with respect to the protection of species included in any category of the IUCN Red List of endangered species did not change relative to previous years. {link to the 2012 Report} So far, the only protected animal species identified as living in the vicinity of our refinery have been peregrine falcon and kestrel.
In 2013, a pair of peregrine falcons built a nest on the platform attached to the stack of the refinery’s CHP plant. The birds are under strict protection in Poland, with only ca. 70 nesting pairs left in the country.
We have also been recording an increasing number of kestrels nesting within the refinery’s premises. In 2013, two such nests were found on refining units − the first one was located on one of the flares, while the second one was situated on the bearing of the flue gas duct in the oils refining furnace. The second nest is particularly worth mentioning, because the area around the duct was to be modernised in connection with the replacement of the unit’s furnace, as announced the year before. However, to allow the protected birds to raise their young until they were ready to leave the nest, we rescheduled the work by nearly a month.
Service station areas
In 2013, the LOTOS service station chain was expanded to include 34 locations operating under the CODO model. 12 of them are newly built stations, with state-of-the-art facilities ensuring environmentally safe operation. In accordance with the applicable regulations, each service station was assessed for environmental impact at the design phase to determine its potential impact on the neighbouring areas, in particular protected sites and areas of high biodiversity value. All the stations were approved for operation and have no impact on protected areas.
The other 22 service stations were acquired on the market from private owners and made compliant with LOTOS standards not only in terms of visual identity and service quality, but also in technological terms.
All the locations selected to be included in the LOTOS service station chain were inspected, with special attention paid to technological solutions and environmental protection documentation. We also reviewed their location in relation to protected areas and any other areas of biodiversity, and performed a risk analysis of the possible impact of each station on the environment. Based on the reviewed documentation and site visits, it was concluded that the service stations newly included in the LOTOS chain were mostly located within towns and cities, away from protected areas.
As at the end of 2013, the chain comprised 256 service stations owned by LOTOS Paliwa. To mitigate the risk of uncontrolled environmental impact, we undertook to monitor each station’s environmental impact beyond the scope of mandatory measures. In line with the CSR strategy for 2012-2015, we reviewed the archived documentation of all service stations. In 2012, the review was carried out for 30% of them, with the remaining 70% covered in 2013.
In some cases, additional assessments were commissioned to review their impact on the local environment and protected areas. These efforts will be spread over two years, with subcontractors (experts with relevant expertise and experience in assessing fuel sector facilities) to be engaged in the first year. We expect that reports produced as part of this initiative, covering ca. 50 service stations, will provide us with detailed information about the facilities’ location with respect to protected areas, and identify potential hazards for the protected areas arising from their operations.
In 2013, no revitalisation work was carried out on areas managed by LOTOS Paliwa.
Land owned by the LOTOS Group is discussed in more detail in the 2012 Report . {link}
Capital expenditure on environmental protection
{GRI EN30}
A substantial decrease in charges for economic use of the natural environment proves that the changes we introduce materially reduce the environmental impact of entities operating as part of the LOTOS Group.
| Item | Costs and expenditure (PLN ’000) | ||
|---|---|---|---|
| 2011 | 2012 | 2013 | |
| Grupa LOTOS | |||
| Costs | |||
| Environmental management costs | 2,685 | 3,143 | 2,137 |
| Environmental protection spending | 20,011 | 23,555* | 22,336 |
| Financing of pro-environmental activities of external institutions | 285 | 525 | 509 |
| Expenditure | |||
| Pro-environmental investment | 12,116 | 67,606 | 63,012 |
| Expenditure on property, plant and equipment** | 114,733 | 141,913 | 202,314 |
| LOTOS Group | |||
| Costs | |||
| Environmental management costs | 25,450 | 4,729 | 4,695 |
| Environmental protection spending | 34,564 | 26,716 | 28,336 |
| Financing of pro-environmental activities of external institutions | 295 | 547 | 509 |
| Environmental insurance*** | 104 | 105 | 194 |
| Expenditure | |||
| Pro-environmental investment | 34,709 | 75,515 | 66,348 |
| Expenditure on property, plant and equipment** | 805,265 | 814,264 | 1,130,446 |
* In 2013, there was a change in our approach to calculating our expenditures on environmental protection, which were extended to include also such costs as were associated with ensuring the proper functioning of the sewage system on the premises of refinery in Gdańsk, etc. Therefore, for the sake of comparability, we have also updated the figures representing our expenditures on environmental protection for 2012 accordingly.
** In 2012 the approach was changed, with property, plant and equipment presented in accordance with the financial statements.
*** Environmental insurance premiums are paid at the LOTOS Group level.
| Item | Expenditure [PLN ‘000] | ||
|---|---|---|---|
| 2011 | 2012 | 2013 | |
| Grupa LOTOS | |||
| Air emissions | 4,268 | 2,980 | 1,256 |
| Water withdrawal | 144 | 140 | 162 |
| Wastewater discharge | 313 | 298 | 316 |
| Waste landfilling | 0 | 0 | 0 |
| Total | 4,725 | 3,418 | 1,734 |
| LOTOS Group | |||
| Air emissions | 4,805 | 3,218 | 1,651 |
| Water withdrawal | 210 | 173 | 240 |
| Wastewater discharge | 487 | 388 | 511 |
| Waste landfilling | 0 | 0 | 0 |
| Total | 5,502 | 3,779 | 2,402 |
Challenges in strategy implementation until 2015
The investment projects completed in 2013 (upgrading one boiler of the CHP plant by converting it into a gas-fired unit, replacing old process furnaces with new and more energy efficient ones at two units, a flare gas redirection system) are fully consistent with our efforts to meet the key objective of the LOTOS Group’s CSR strategy in the Management of natural resources in the production process area, which is to reduce the environmental risk and seek to continually minimise the environmental impact of the LOTOS Group’s operations.
Actions mitigating the LOTOS Group’s negative impact will be continued. In 2014, the fourth, and last, boiler of the Grupa LOTOS CHP plant is to be converted to a gas-fired unit. The completion of this task will allow us to fully meet the stringent emission standards regarding large gas combustion units (power plants/CHP plants), which are to come into force as of January 1st 2016.
Development prospects until 2020
Further reduction of the LOTOS Group’s negative environmental impact will be possible thanks to the implementation of two more environmental objectives set for the coming years, which are:
- To improve the energy efficiency of the steam heating system of pipelines connecting units;
- To decrease the primary energy consumption of the Grupa LOTOS refinery through modernising further process furnaces.
These actions contribute to further improvement of the energy efficiency, and thus are in line with the objective of mitigating our negative impact on the natural environment.


 E-mail
 Facebook
 Google+
 Twitter